
You can see the progress of your event and the details of the topics listed below in the form of charts or information boxes on the event 'Dashboard' page.
To access the dashboard, click 'Event Homepage' from the left side menu and then the 'Dashboard' option under the ‘EVENT’ title.
- Event Summary
- Event Revenue
- Registration
- Abstracts
- Virtual Event
Note that, only the details of the solutions you used will be displayed in the Dashboard.
The provided charts can be displayed as bar charts, line diagrams, pie charts or as a list according to the content type by clicking the relevant buttons at the right upper corner of each item.
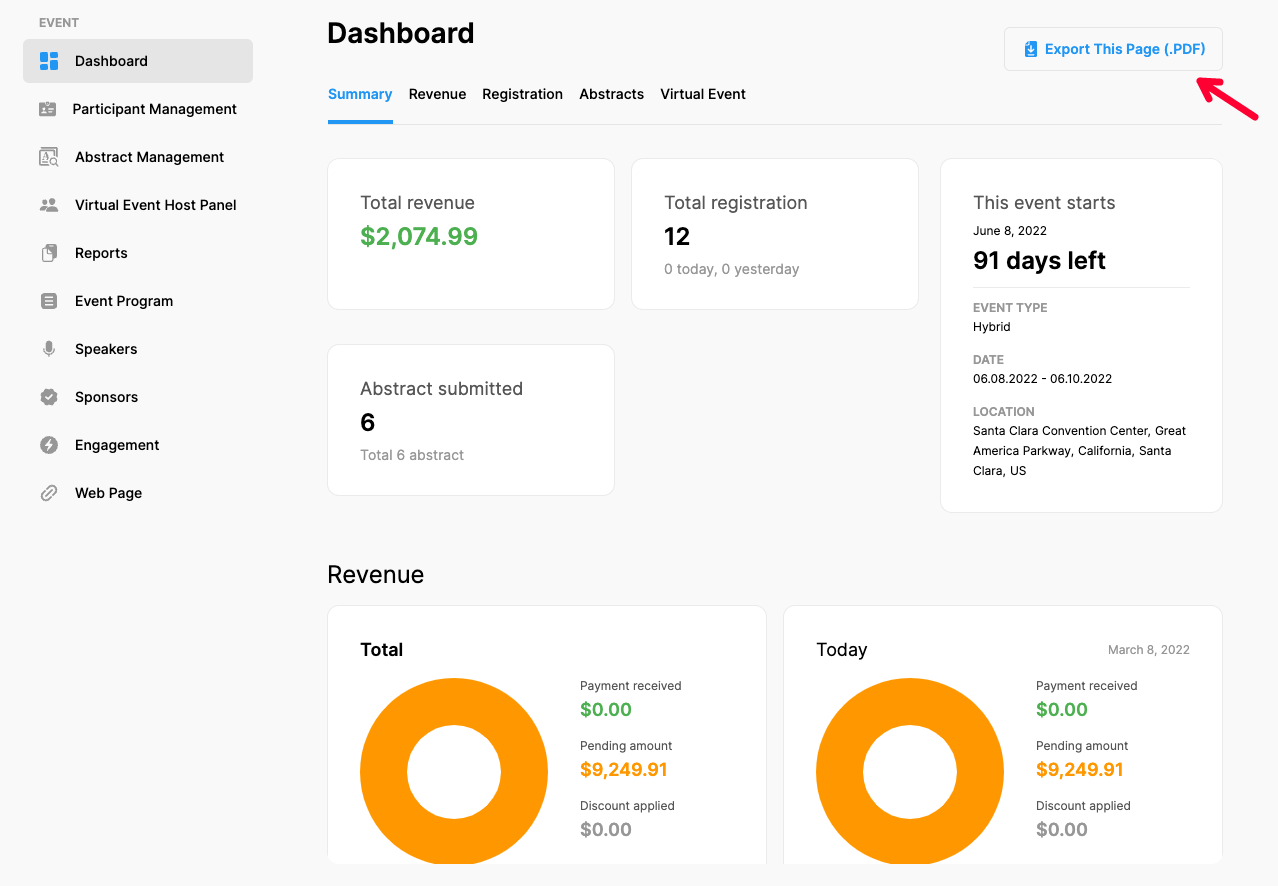
Exporting Dashboard as a PDF file
The ‘Dashboard’ can be exported as a PDF file by clicking the ‘Export This Page (.PDF)’ button at the top right corner of the page.
Comments
0 comments
Please sign in to leave a comment.